一般没有用alley的吧。中国翻译法

英文里比较小的街道一般用 ln. ct. 就是 lane, court的意思

比这个大一些的叫做dr. st. drive, street

在大一些是road, ave.

弄堂翻译成ln. 比较合适

一般是这么翻译:

17 335th ln. off Gonghexin rd.
apt 505
shanghai, xxxxxx
china.

505室一般写在第二行(如果有的话)下一行一般是 城市,州/省,邮编,最下一行国家。

多少弄一般不写作 lane xxx, 而是xxxth(nd,st,rd) ln.(lane)

举个例子
1008 29th St,
Ashland, Boyd, Kentucky 41101
U.S.A
Wednesday, 6 January 2010
Lane翻译,zz
转:How Do I Write a Business Analyst Resume?
A Business Analyst is responsible for analyzing the business needs of their customers (small to large businesses) and coming up with solutions to business problems. Despite the job being highly skilled, time and time again, the question; how do I write a Business Analyst resume? Comes up. It is time to answer this question once and for all, by giving helpful hints and tips on addressing the question “How do I write a Business Analyst resume?”
Firstly, you must outline the skills and knowledge required of the job, show that you possess these skills and knowledge and link it to experience and/or education. So lets look at each of these in turn.(Y:目标导向)
You must have knowledge of the subject of the business; there is no point in asking “how do I write a business analyst resume?” if you don’t even had the skills or experience to list on your resume. Whilst complexity varies, this is relatively important to include on your business analyst resume.
Secondly, you must have the skills of Business Processes, this is instrumental in business process re-engineering. There are a number of tools used for this, make sure you include your knowledge and experience in your resume. Furthermore, you need IT capabilities, Feasibility, and Relevance knowledge. These need to be addressed in turn on your resume or included in your experience. Hopefully by this stage you should be getting a better idea of how do I write a business analyst resume.
Finally, make sure you list any certifications, and if your experience is in a different field, make sure you link the prerequisites of analytical skills, and technical/business background.
转:一个牛人的CV
虽然是银行类,但是很有借鉴意义
http://www.alanscully.com/
Alan SCULLY
contact: my first name . my last name @gmail.com
Nationality British
Date of Birth 1972.10.22
Location Currently in Tokyo, Japan. Willing to relocate.
Brief
I am currently living in Tokyo, Japan working as in Business Analyst and IT Risk roles (dual-heading) for a major investment bank. Previous to living in Japan, I lived in Seoul, Korea, in Hong Kong, and in London, England.
I have long term experience working in IT in Investment Banking. From starting out as a developer, I've co-ordinated projects, become a Business Analyst, and recently moved into IT Risk. Although most of my career has been in Equity Derivatives and Cash, I have worked with Private Banking, Compliance, IT Risk, Business Continuity Management, Support, Operations, and Asset Management and liased with exchange bodies and external vendors. I have worked with London, Hong Kong, Japan, Korea, Australia, New York, and offsite development centers (eg Singapore, Pune).
Exposure across the investment bank has given me vision and insight that others may lack - an understanding of regulatory concerns in highly regulated areas such as Korea and Japan; ability to identify common solutions which will work across departments and locations; attention to disaster recovery, reliability, and support issue management.
Outside investment banking, as Chief Technology Officer of an internet company, I managed a team of developers, infrastructure specialists, and designers, as well as co-ordinating and reporting at board level.
I reached Vice President level at Citigroup at the age of 27.
I would be most suited to a senior role which involves co-ordination across departments and locations, where attention to regulatory and reliability issues is of upmost importance. This could be in an area in which I have worked before - such as IT Risk, BCM, Business Analysis - or in another senior IT management or project co-ordination role in an area I have not worked before. I am looking forward to bringing my experience and drive to a new company and addressing new challenges.
Languages
English - Native speaker. Korean - Intermediate (see Education).
Education
Sogang University, South Korea - Korean Language - 2003 to 2005
University Of Glasgow, UK - BSc (Hons) Computing Science - First Class - 1990 to 1994
Employment History
Major Investment Bank (Japan) - Vice President (VP) – September 2006 to Present
Business analysis and management of high profile key Equities projects such as the in-house electronic trading system, integrating trading and booking systems with Private Banking, business continuity planning (ensuring trading can continue in the event of a disaster), trade reporting, and legal ticketing. Co-ordinating between departments and across locations, managing the book of work for several development groups. Recently dual-heading with an IT Risk role, involving investigating systems for compliance against exchange regulations, and recommending changes to improve production stability and reduce IT risks from project design time.
UBGlobal (Korea) - Senior Manager - Dec 2005 to March 2006
Report directly to company owners and advise on company restructuring. Business analysis and project management, including planning of international marketing strategy and managing developers working on internet site upgrades.
Education: Sogang University (Korea) - Korean Language - 2003 to 2005
Citigroup, Salomon Smith Barney (Hong Kong) - Independent Consultant - June 2001 to Jan 2003
Business analysis, project management, development, and support in Equity Derivatives: Korea KOSDAQ and KSE exchange connectivity, external broker connectivity, trading system enhancements (eg, basket trading, risk viewing). Liaison between HK and Korea, legal, compliance, traders, exchanges, and vendors. Frequent visits to Korea. Daily direct interaction with traders, including business analysis with the desk heads and trader support.
Saffron Hill Venture Capital (UK) - Chief Technology Officer - May 2000 to June 2001
First in the role of Technical Development Manager, evaluating companies for potential investment, business analysis and management of internet projects within portfolio companies. Promoted to Chief Technology Officer of a Saffron Hill portfolio company, managing a team of developers, infrastructure specialists, and designers. Tasked to analyse and turn around the failing launch of the company's portal and shopping internet sites. Under my management the extensively delayed projects were successfully completed, and the portal website won an award as the UK's best Asian internet site.
Citigroup, Salomon Smith Barney (UK) - Vice President (VP) - June 1998 to April 2000
Project management, development, and support in Equity Derivatives: LIFFE, XETRA, and LSE exchange connectivity, trading system enhancements (eg, strategy trading, automatic market making, arbitrage opportunity searching), risk management (live and reporting). Liaison between Citigroup and exchanges. Representing Citigroup and performing exchange acceptance tests. Daily direct interaction with the traders. Achieved Vice President position due to consistent and accurate delivery of high profile trading projects.
Morgan Stanley Dean Witter Limited (UK) - Developer - July 1997 to June 1998
Project management, development, and support in Global Equity Cash Trading, in charge of the Order Management application in London. Impact analysis of global changes to London. Local modifications. Designed enhancements for real time international internal order routing. Created web based support system. Co-ordinated with New York and Tokyo Japan. Represented London in global meetings. Managed relationship with users and support staff.
Salomon Brothers International Limited (UK) - Developer - July 1994 to July 1997
Project management, development, and support in Market Data and Equity Derivatives teams: SOFFEX exchange connectivity, design of an external broker intranet trading system, and Tibco market data projects.
J P Morgan (UK) - Intern - July 1993 to September 1993
Intern position before final year of university. Development in Global SWAPs.
Education: University Of Glasgow (UK) - BSc (Hons) Computing Science, First Class - 1990 to 1994
Interests
My interests include healthy living, appreciation of music, comedy, cooking (Mexican, Italian, and Korean), photography, hiking, and language.
ZZ:Business Analysis Career Path
The Business Analysis Career Path has been an ongoing discussion within IT circles for quite a while. If you browse through the blogs in the ‘Business Analysis’ category here, you should find more information on Business Analysis and how it fits into the overall IT organization and project structures. Assuming that all the readers have some background understanding, I am discussing some of the career path related matters here.
To start a career in BA, a person needs to have either business background in the specific industry domain or a broad IT knowledge. Given that this basic foundation exists, someone can step in to the BA world! This starting step would be something like Systems Analyst or Associate/Junior Systems Analyst. After the systems analysis skills are fully achieved, the person can move to be a Business Analyst. Progressively, this could start from something like Associate/Junior BA and then move to be a BA and when at a highly skilled autonomous level, a Senior/Lead BA.
Around this area, it becomes quite a discussion where a person can/should go. In a way, it’s a business decision based on what can be taken out of such individuals based on the skills they posses and also a personal decision what each individual want to do in their careers and also what they want to achieve in their respective lives. I personally see two branches from here onwards and upwards and also notice that most organizations have adopted these two progression paths.
One is to grow within the same line but take on more challenging opportunities. Becoming a Business Consultant would be the next best position to move in this path. The second branch is to move to Project/General Management. The knowledge gained on scoping projects, managing projects, change management and extensive business knowledge will be highly helpful for a successful career if someone decides to take on this path. If someone decides not to move onto management, Business Consultancy would offer a great amount of opportunities and exciting challenges as it’s a career path of its own and as most people would say, the sky is the only limit! It’s a highly autonomous position where you get to lead people, manage client expectations, propose solutions and involve in negotiations etc. As a consultant, avoiding management wouldn’t be possible, but still you would be a leader who understands what’s being done which makes it easier to stay on top of things and lead others to success.
Last but not least, this is a very interesting, challenging area within the IT industry which offers so many opportunities even though we find fewer people interested in it comparatively. If I have been able to create some interest and awareness, I can be happy......
zz: A Data Analyst's Typical Day
What is a typical day for a data analyst? Is it one that begins with a commute to work and ends with a commute home? Is it one that finds the data analyst satisfied with his/her day or frustrated and/or angry? Does this analyst sleep peacefully or dream of blue screens? Does the morning find the data analyst excited at the prospect of new challenges or hoping that the day goes quickly?My days include all of the above possibilities. Some are more interesting and enjoyable than others. But the reason I keep at it? As a data analyst, I often find myself loosing track of time and place as I:
1. Learn to use new software to answer old business questions
2. Discover the source data that causes the problems downstream
3. Uncover simpler ways of doing things
4. Forage through rows of data, realizing patterns
5. Build new reports that answer unusual end-user questions
6. Modify reports to correct longstanding problems
7. Listen intently to a manager, translating what she says into data fields
8. Design queries for different legacy databases using multiple BI packages
9. Figure out how tho make these queries yield comparable data
10. Present reports to customers that elicit good questions and no doubts
I have managed people and projects, and sold products and relationships. All of these activities have proved challenging, but none has captured my attention in the way data analysis does. Mihaly Csikszentmihalyi, a brilliant observer of human experience, calls this experience 'flow.' Flow is a psychophysiological state that occurs when people perform challenging tasks, feeling intense concentration and a sense of commitment.
That's me, a data analyst, staring at a computer screen, feeling that this user's question is the most important thing. A thrill charges through me when I discover how the *!$%#@! (innacurate) data is getting into the database. I enjoy a brief sense of confidence when I identify a business trend that is built on (relatively) clean data.
BTW, I call myself a data -- or a business -- analyst. I realize that data analyst, database analyst, systems analyst, business analyst, reporting specialist, etc. are used interchangeably in today's job market. Until you read the job description, there's no way to know the skills needed. I've decided that this an issue that doesn't interest me. As far as I can tell, job descriptions cause more problems than they solve. They are commonly static, hierarchical, and vague in a business climate/world that isn't.
If you want, tell us all what you think about any of the above. I'd like to have a more accurate understanding of how strange I really am -- relative to the rest of you.
zz Data Analyst-Sample Resume - Resume Writing
Amy Smith
123 Main Street
Atlanta, Georgia 30339
Home: (555) 555-1234
Cell: (555) 555-1235
asmith@sample~resume.com
More than twelve years of experience with reporting software, including Business Objects, Crystal Reports, Cognos. Sound understanding of relational and denormalized databases. Working knowledge of SQL required. Proficient with Siebel, Aspect Call Center, and Aspect Data Mart.
Employment History
1997 - Present Data Analyst
Institute for Data Research, Oceanside, CA
Planned and built a large Perl application for translation of legacy HTML documentation in XML. Planned and built Java servlets for serving dynamic content using XML/XSLT. Personally developed many custom programs for transformation of legacy data for large clients using Perl/Python. Authored and taught modules and courses dealing with topics such as Strategic Implications of XML for Organizations, XSLT Programming, XML Architecture and related topics to audiences primarily consisting of CIOs, data analysts, and data managers.
1994 - 1997 Junior Data Analyst
Capital Financial, Eugene, OR
Wrote Unix utilities on HP/UX, Linux, and Unix System Services for OS/390. Wrote web front ends for user tracking systems using Perl, GI, and RDBMS's. Coordinated company-wide rollout of software packages to 3 different platforms.
Education
1990 B.A., Computer Science
University of Texas, Austin, TX
123 Main Street
Atlanta, Georgia 30339
Home: (555) 555-1234
Cell: (555) 555-1235
asmith@sample~resume.com
Objective
Data Analyst
Summary
More than twelve years of experience with reporting software, including Business Objects, Crystal Reports, Cognos. Sound understanding of relational and denormalized databases. Working knowledge of SQL required. Proficient with Siebel, Aspect Call Center, and Aspect Data Mart.
Employment History
1997 - Present Data Analyst
Institute for Data Research, Oceanside, CA
Planned and built a large Perl application for translation of legacy HTML documentation in XML. Planned and built Java servlets for serving dynamic content using XML/XSLT. Personally developed many custom programs for transformation of legacy data for large clients using Perl/Python. Authored and taught modules and courses dealing with topics such as Strategic Implications of XML for Organizations, XSLT Programming, XML Architecture and related topics to audiences primarily consisting of CIOs, data analysts, and data managers.
1994 - 1997 Junior Data Analyst
Capital Financial, Eugene, OR
Wrote Unix utilities on HP/UX, Linux, and Unix System Services for OS/390. Wrote web front ends for user tracking systems using Perl, GI, and RDBMS's. Coordinated company-wide rollout of software packages to 3 different platforms.
Education
1990 B.A., Computer Science
University of Texas, Austin, TX
zz:What Does a Data Analyst Do?
A data analyst is a highly trained individual that specializes in collecting, organizing, and analyzing data from various resources. For example, the data may be obtained from secondary source documents such as statistical studies, or from direct consumer marketing surveys. In terms of analysis, the data analyst generally uses data management and reporting systems to collect and organize specific data drawn from relational databases. While this process is largely automated, it must first be initiated by developing mathematical computations and collection protocols in order to extract and extrapolate data into meaningful statistical analysis or “what if” scenarios.
Although the primary tasks of this position are compilation and analysis of numerical information, a data analyst often takes on other roles. For one thing, he or she is expected to possess a certain degree of technical expertise with automatic data collection and reporting systems, including a capacity for program troubleshooting and system security measures. Depending on the nature of the data being collected and analyzed, the individual may also be required to be familiar with procedural standards and regulations specific to a particular area of research, industry, or market. In addition, data analysts often engage in making projections regarding future trends based on current economic and/or market conditions. In some cases, the data analyst may be involved the research phase of a project by participating in the design and implementation of relevant studies and surveys.
Most data analysts are also comfortable with the reporting aspects of data analysis in terms of preparing written summaries to accompany graphs and charts. However, this position often calls for additional writing tasks, such as drafting company memorandum, press releases, or other documentation. In addition, this position often lends itself to collaborating with database programmers and administrators in writing system modification recommendations, or in-house instruction and training materials.
Data analysts typically find employment in a business or clinical setting and can usually expect to work a 40-hour week. However, certain projects or those given high priority status may require devoting an occasional evening or weekend to the job. In addition, some data analysts find that they can work from home or other remote location a few days a week or more. In fact, as communications technology continues to advance, this trend is becoming increasingly more feasible.
In terms of qualifications, a minimum of a four-year degree from a college or university is usually required, preferably in statistics, computer science, or business administration. However, other coursework may be acceptable if the candidate can also demonstrate substantial experience working in a related field, such as statistical analysis or research. Of course, many professionals entering this field obtain a Master’s Degree in order to maximize their starting salary and advancement potential.
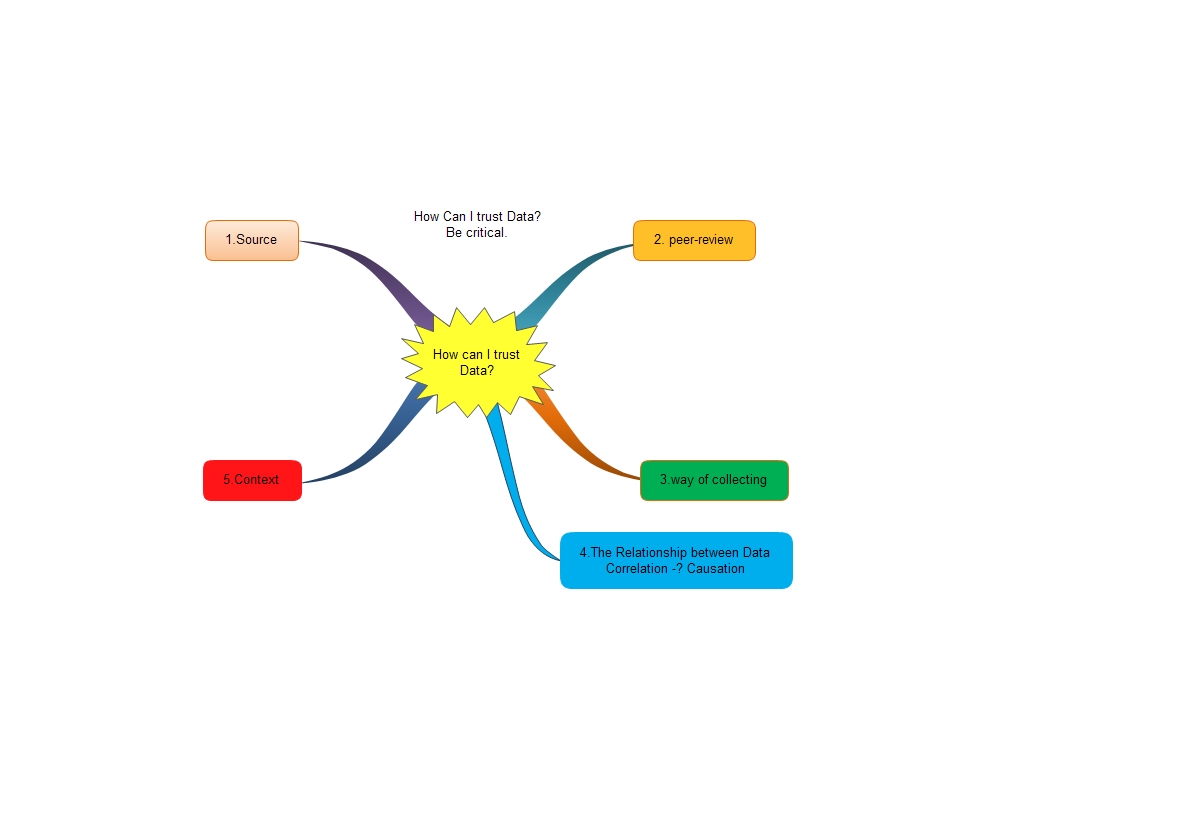
zz Data Analysis Process
An interesting article....easy to understand.
Summary, be critical..... MindMap Chart Below...
By Robert Niles
You wouldn't buy a car or a house without asking some questions about it first. So don't go buying into someone else's data without asking questions, either.
Okay, you're saying... but with data there are no tires to kick, no doors to slam, no basement walls to check for water damage. Just numbers, graphs and other scary statistical things that are causing you to have bad flashbacks to your last income tax return. What the heck can you ask about data?
Plenty. Here are a few standard questions you should ask any human beings who slap a pile of data in front of you and ask you write about it.
Where did the data come from? Always ask this one first. You always want to know who did the research that created the data you're going to write about.
You'd be surprised - sometimes it turns out that the person who is feeding you a bunch of numbers can't tell you where they came from. That should be your first hint that you need to be very skeptical about what you are being told.
Even if your data have an identifiable source, you still want to know what it is. You might have some extra questions to ask about a medical study on the effects of secondhand smoking if you knew it came from a bunch of researchers employed by a tobacco company instead of from, say, a team of research physicians from a major medical school, for example. Or if you knew a study about water safety came from a political interest group that had been lobbying Congress for a ban on pesticides.
Just because a report comes from a group with a vested interest in its results doesn't guarantee the report is a sham. But you should always be extra skeptical when looking at research generated by people with a political agenda. At the least, they have plenty of incentive NOT to tell you about data they found that contradict their organization's position.
Which brings us to the next question:
Have the data been peer-reviewed? Major studies that appear in journals like the New England Journal of Medicine undergo a process called "peer review" before they are published. That means that professionals - doctors, statisticians, etc. - have looked at the study before it was published and concluded that the study's authors pretty much followed the rules of good scientific research and didn't torture their data like a middle ages infidel to make the numbers conform to their conclusions.
Always ask if research was formally peer reviewed. If it was, you know that the data you'll be looking at are at least minimally reliable.
And if it wasn't peer-reviewed, ask why. It may be that the research just wasn't interesting to enough people to warrant peer review. Or it could mean that the research had as much chance of standing up to professional scrutiny as a $500 mobile home has of standing up in a tornado.
How were the data collected? This one is real important to ask, especially if the data were not peer-reviewed. If the data come from a survey, for example, you want to know that the people who responded to the survey were selected at random.
In 1997, the Orlando Sentinel released the results of a poll in which more than 90 percent of those people who responded said that Orlando's National Basketball Association team, the Orlando Magic, shouldn't re-sign its center, Shaquille O'Neal, for the amount of money he was asking. The results of that poll were widely reported as evidence that Shaq wasn't wanted in Orlando, and in fact, O'Neal signed with the Los Angeles Lakers a few days later.
Unfortunately for Magic fans, that poll was about as trustworthy as one of those cheesy old "Magic 8 Balls." The survey was a call-in poll where anyone who wanted could call a telephone number at the paper and register his or her vote.
This is what statisticians call a "self-selected sample." For all we know, two or three people who got laid off that morning and were ticked off at the idea of someone earning $100 million to play basketball could have flooded the Sentinel's phone lines, making it appear as though the people of Orlando despised Shaq.
Another problem with data is "cherry-picking." This is the social-science equivalent of gerrymandering, where you draw up a legislative district so that all the people who are going to vote for your candidate are included in your district and everyone else is scattered among a bunch of other districts.
Be on the lookout for cherry-picking, for example, in epidemiological (a fancy word for the study of disease that sometimes means: "We didn't go out and collect any data ourselves. We just used someone else's data and played 'connect the dots' with them in an attempt to find something interesting.") studies looking at illnesses in areas surrounding toxic-waste dumps, power lines, high school cafeterias, etc. It is all too easy for a lazy researcher to draw the boundaries of the area he or she is looking at to include several extra cases of the illness in question and exclude many healthy individuals in the same area.
When in doubt, plot the subjects of a study on map and look for yourself to see if the boundaries make sense.
Be skeptical when dealing with comparisons. Researchers like to do something called a "regression," a process that compares one thing to another to see if they are statistically related. They will call such a relationship a "correlation." Always remember that a correlation DOES NOT mean causation.
A study might find that an increase in the local birth rate was correlated with the annual migration of storks over the town. This does not mean that the storks brought the babies. Or that the babies brought the storks.
Statisticians call this sort of thing a "spurious correlation," which is a fancy term for "total coincidence."
People who want something from others often use regression studies to try to support their cause. They'll say something along the lines of "a study shows that a new police policy that we want led to a 20 percent drop in crime over a 10-year period in (some city)."
That might be true, but the drop in crime could be due to something other than that new policy. What if, say, the average age of those cities' residents increased significantly over that 10 year period? Since crime is believed to be age-dependent (meaning the more young men you have in an area, the more crime you have), the aging of the population could potentially be the cause of the drop in crime.
The policy change and the drop in crime might have been correlated. But that does not mean that one caused the other.
Finally, be aware of numbers taken out of context. Again, data that are "cherry picked" to look interesting might mean something else entirely once it is placed in a different context.
Consider the following example from Eric Meyer, a professional reporter now working at the University of Illinois:
My personal favorite was a habit we use to have years ago, when I was working in Milwaukee. Whenever it snowed heavily, we'd call the sheriff's office, which was responsible for patrolling the freeways, and ask how many fender-benders had been reported that day. Inevitably, we'd have a lede that said something like, "A fierce winter storm dumped 8 inches of snow on Milwaukee, snarled rush-hour traffic and caused 28 fender-benders on county freeways" -- until one day I dared to ask the sheriff's department how many fender-benders were reported on clear, sunny days. The answer -- 48 -- made me wonder whether in the future we'd run stories saying, "A fierce winter snowstorm prevented 20 fender-benders on county freeways today." There may or may not have been more accidents per mile traveled in the snow, but clearly there were fewer accidents when it snowed than when it did not.
It is easy for people to go into brain-lock when they see a stack of papers loaded with numbers, spreadsheets and graphs. (And some sleazy sources are counting on it.) But your readers are depending upon you to make sense of that data for them.
Use what you've learned on this page to look at data with a more critical attitude. (That's critical, not cynical. There is a great deal of excellent data out there.) The worst thing you can do as a writer is to pass along someone else's word about data without any idea whether that person's worth believing or not.
zz 节选自wikipedia about data analysis
Data analysis is a process of inspecting, cleaning, transforming, and modelling data with the goal of highlighting useful information, suggesting conclusions, and supporting decision making. Data analysis has multiple facets and approaches, encompassing diverse techniques under a variety of names, in different business, science, and social science domains.
Data mining is a particular data analysis technique that focuses on modeling and knowledge discovery for predictive rather than purely descriptive purposes. Business intelligence covers data analysis that relies heavily on aggregation, focusing on business information. In statistical applications, some people divide data analysis into descriptive statistics, exploratory data analysis, and confirmatory data analysis. EDA focuses on discovering new features in the data and CDA on confirming or falsifying existing hypotheses. Predictive analytics focuses on application of statistical or structural models for predictive forecasting or classification, while text analytics applies statistical, linguistic, and structural techniques to extract and classify information from textual sources, a species of unstructured data. All are varieties of data analysis.
Data integration is a precursor to data analysis, and data analysis is closely linked to data visualization and data dissemination. The term data analysis is sometimes used as a synonym for data modeling, which is unrelated to the subject of this article.
The process of data analysis
Data analysis is a process, within which several phases can be distinguished:[1]
- Data cleaning
- Initial data analysis (assessment of data quality)
- Main data analysis (answer the original research question)
- Final data analysis (necessary additional analyses and report)
Data cleaning
Data cleaning is an important procedure during which the data are inspected, and erroneous data are -if necessary, preferable, and possible- corrected. Data cleaning can be done during the stage of data entry. If this is done, it is important that no subjective decisions are made. The guiding principle provided by Adèr (ref) is: during subsequent manipulations of the data, information should always be cumulatively retrievable. In other words, it should always be possible to undo any data set alterations. Therefore, it is important not to throw information away at any stage in the data cleaning phase. All information should be saved (i.e., when altering variables, both the original values and the new values should be kept, either in a duplicate dataset or under a different variable name), and all alterations to the data set should carefully and clearly documented, for instance in a syntax or a log.[2]
Initial data analysis
The most important distinction between the initial data analysis phase and the main analysis phase, is that during initial data analysis one refrains from any analysis that are aimed at answering the original research question. The initial data analysis phase is guided by the following four questions:[3]
Quality of data
The quality of the data should be checked as early as possible. Data quality can be assessed in several ways, using different types of analyses: frequency counts, descriptive statistics (mean, standard deviation, median), normality (skewness, kurtosis, frequency histograms, normal probability plots), associations (correlations, scatter plots).
Other initial data quality checks are:
- Checks on data cleaning: have decisions influenced the distribution of the variables? The distribution of the variables before data cleaning is compared to the distribution of the variables after data cleaning to see whether data cleaning has had unwanted effects on the data.
- Analysis of missing observations: are there many missing values, and are the values missing at random? The missing observations in the data are analyzed to see whether more than 25% of the values are missing, whether they are missing at random (MAR), and whether some form of imputation (statistics) is needed.
- Analysis of extreme observations: outlying observations in the data are analyzed to see if they seem to disturb the distribution.
- Comparison and correction of differences in coding schemes: variables are compared with coding schemes of variables external to the data set, and possibly corrected if coding schemes are not comparable.
The choice of analyses to assess the data quality during the initial data analysis phase depends on the analyses that will be conducted in the main analysis phase.[4]
Quality of measurements
The quality of the measurement instruments should only be checked during the initial data analysis phase when this is not the focus or research question of the study. One should check whether structure of measurement instruments corresponds to structure reported in the literature.
There are two ways to assess measurement quality:
- Confirmatory factor analysis
- Analysis of homogeneity (internal consistency), which gives an indication of the reliability of a measurement instrument, i.e., whether all items fit into a unidimensional scale. During this analysis, one inspects the variances of the items and the scales, the Cronbach's α of the scales, and the change in the Cronbach's alpha when an item would be deleted from a scale.[5]
Initial transformations
After assessing the quality of the data and of the measurements, one might decide to impute missing data, or to perform initial transformations of one or more variables, although this can also be done during the main analysis phase.[6]
Possible transformations of variables are:[7]
- Square root transformation (if the distribution differs moderately from normal)
- Log-transformation (if the distribution differs substantially from normal)
- Inverse transformation (if the distribution differs severely from normal)
- Make categorical (ordinal / dichotomous) (if the distribution differs severely from normal, and no transformations help)
Did the implementation of the study fulfill the intentions of the research design?
One should check the success of the randomization procedure, for instance by checking whether background and substantive variables are equally distributed within and across groups.
If the study did not need and/or use a randomization procedure, one should check the success of the non-random sampling, for instance by checking whether all subgroups of the population of interest are represented in sample.
Other possible data distortions that should be checked are:
- dropout (this should be identified during the initial data analysis phase)
- Item nonresponse (whether this is random or not should be assessed during the initial data analysis phase)
- Treatment quality (using manipulation checks).[8]
Characteristics of data sample
In any report or article, the structure of the sample must be accurately described. It is especially important to exactly determine the structure of the sample (and specifically the size of the subgroups) when subgroup analyses will be performed during the main analysis phase.
The characteristics of the data sample can be assessed by looking at:
- Basic statistics of important variables
- Scatter plots
- Correlations
- Cross-tabulations[9]
Final stage of the initial data analysis
During the final stage, the findings of the initial data analysis are documented, and necessary, preferable, and possible corrective actions are taken.
Also, the original plan for the main data analyses can and should be specified in more detail and/or rewritten.
In order to do this, several decisions about the main data analyses can and should be made:
- In the case of non-normals: should one transform variables; make variables categorical (ordinal/dichotomous); adapt the analysis method?
- In the case of missing data: should one neglect or impute the missing data; which imputation technique should be used?
- In the case of outliers: should one use robust analysis techniques?
- In case items do not fit the scale: should one adapt the measurement instrument by omitting items, or rather ensure comparability with other (uses of the) measurement instrument(s)?
- In the case of (too) small subgroups: should one drop the hypothesis about inter-group differences, or use small sample techniques, like exact tests or bootstrapping?
- In case the randomization procedure seems to be defective: can and should one calculate propensity scores and include them as covariates in the main analyses?[10]
Analyses
Several analyses can be used during the initial data analysis phase:[11]
- Univariate statistics
- Bivariate associations (correlations)
- Graphical techniques (scatter plots)
It is important to take the measurement levels of the variables into account for the analyses, as special statistical techniques are available for each level:[12]
- Nominal and ordinal variables
- Frequency counts (numbers and percentages)
- Associations
- circumambulations (crosstabulations)
- hierarchical loglinear analysis (restricted to a maximum of 8 variables)
- loglinear analysis (to identify relevant/important variables and possible confounders)
- Exact tests or bootstrapping (in case subgroups are small)
- Computation of new variables
- Continuous variables
- Distribution
- Statistics (M, SD, variance, skewness, kurtosis)
- Stem-and-leaf displays
- Box plots
- Distribution
Subscribe to:
Comments (Atom)